Reading Cannabis COAs: What Labs Hide and Numbers That Matter
Certificate of analysis reports determine pricing and compliance, but most growers misread potency claims, miss pesticide red flags, and ignore the data labs bury.
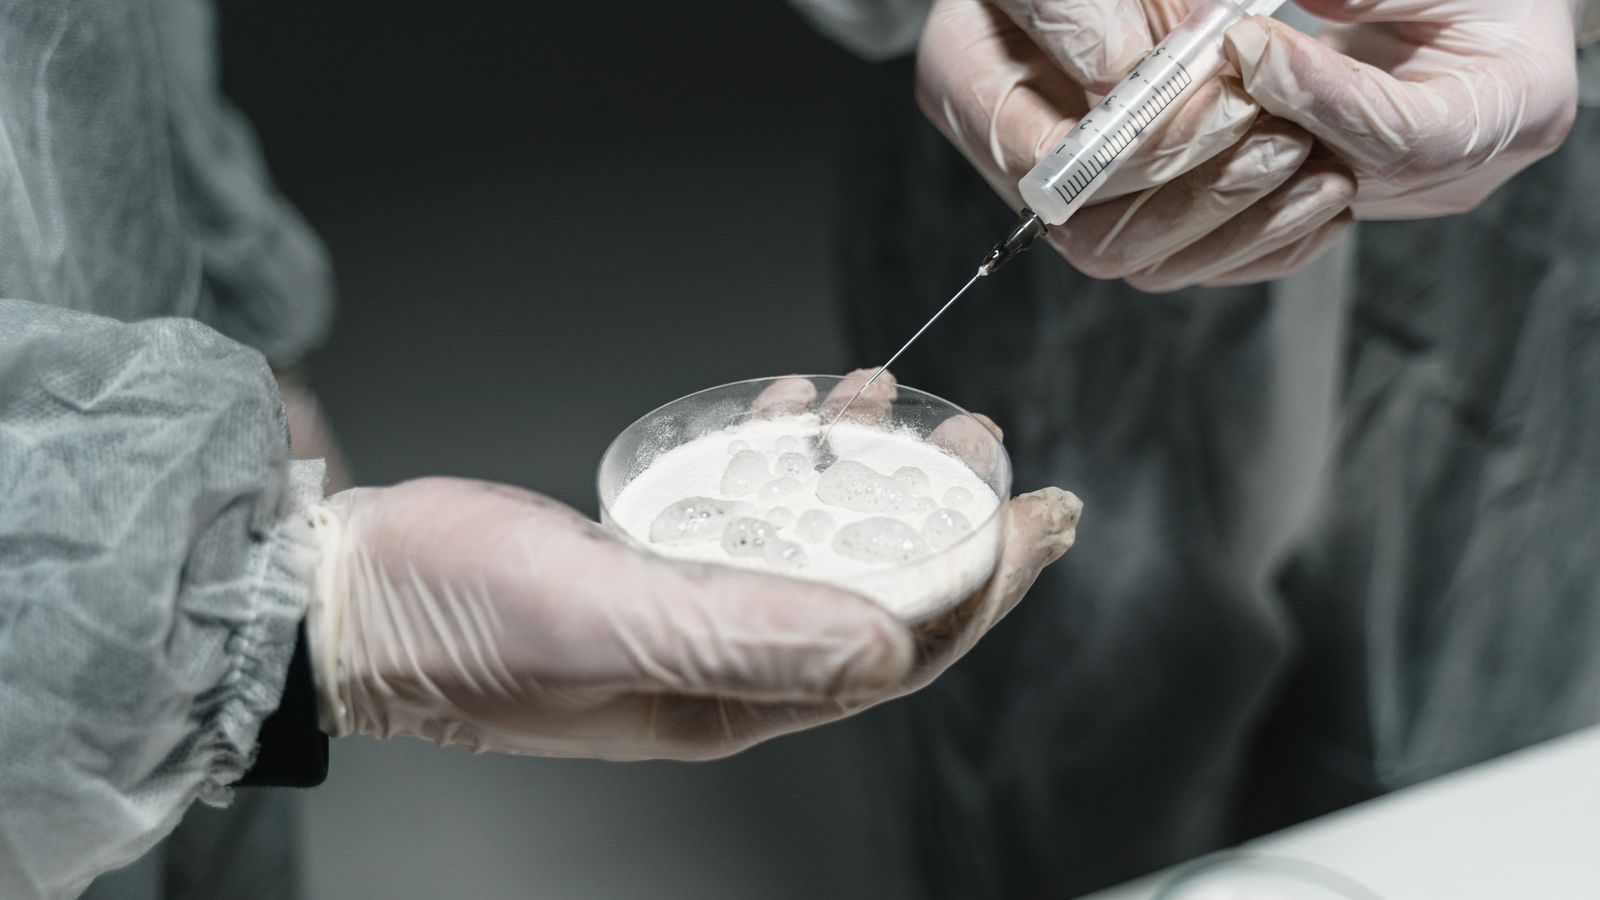
Researchers conducting a scientific experiment with a syringe and petri dish in a lab setting.
The COA is the most consequential document in your post-harvest workflow. It dictates pricing negotiations with distributors, determines whether a batch passes state testing requirements, and provides the only third-party verification of what you grew. Yet most producers treat it as a formality, a box to check before product moves. The result: money left on the table, compliance surprises, and batches that test clean on paper but fail at the dispensary level.
Understanding what a certificate of analysis actually measures, how labs report data, and where the gaps exist requires looking past the top-line numbers. This guide covers cannabinoid quantification methods, pesticide panel structures, microbial and heavy metal testing protocols, and the reporting tricks that make marginal flower look better than it is.
Cannabinoid Testing: Total THC vs. THCA and Why the Math Matters
The first number most growers check is total THC. This figure represents the sum of delta-9 THC and the converted value of THCA, the acidic precursor that dominates in raw flower. The conversion uses a standard formula: total THC = delta-9 THC + (THCA × 0.877). The 0.877 factor accounts for the loss of a carboxyl group during decarboxylation, the process that activates THCA when flower is heated.
Here's the problem: labs report THCA and delta-9 THC separately, then calculate total THC. A flower sample might show 0.8% delta-9 THC and 22.3% THCA, yielding a total THC of 20.3%. That total is what appears on dispensary labels and drives pricing. But the actual delta-9 content, the compound responsible for immediate psychoactive effects, is under 1%. For producers targeting concentrates or edibles, this distinction matters less because extraction and processing decarboxylate cannabinoids. For flower sales, it's critical.
Some labs push samples toward higher totals by testing at moisture levels below what the flower will hold in a jar. Cannabis tested at 8% moisture will show higher cannabinoid percentages by weight than the same flower at 12% moisture. A 2% swing in moisture content can shift reported THC by 0.5 to 1 percentage point. State regulations vary on moisture correction, and not all labs apply it consistently.
Then there's the question of sample prep. Homogenization, the process of grinding and mixing flower before testing, introduces variability. A single cola from the top of a plant will test higher than a mix of top, middle, and lower buds. Some producers cherry-pick their best flowers for compliance testing, knowing the COA will represent the entire batch. This is legal in most states as long as the sample meets minimum weight requirements, but it creates a gap between tested potency and what ends up in retail packaging.
Beyond THC, COAs report CBN, CBG, CBD, and other cannabinoids. CBN levels above 0.3% suggest degradation, either from light exposure, heat, or age. Flower with elevated CBN and lower THC than expected likely sat too long before testing or was stored poorly. CBG content varies by genetics, but levels above 1% are rare in most commercial strains. If a COA shows unusually high CBG, the sample may have been harvested early, before CBGA fully converted to THCA.
Pesticide Panels: Action Levels, Detection Limits, and What Gets Reported
Pesticide testing is where COAs get opaque. State-mandated panels test for 60 to 100 compounds, depending on jurisdiction. Each compound has an action level, the concentration above which a batch fails. But labs also have detection limits, the lowest concentration they can reliably measure. A pesticide can be present below the action level but above the detection limit, and the COA will show it as detected but passing.
This creates a gray zone. A sample might show myclobutanil at 0.08 ppm, below the 0.1 ppm action level but well above the 0.02 ppm detection limit. The batch passes, but the presence of myclobutanil, a systemic fungicide that converts to hydrogen cyanide when combusted, is a red flag. Some buyers, particularly those supplying medical markets or producing concentrates, reject batches with any detectable pesticide residue regardless of action levels.
Labs report pesticides in parts per million or parts per billion, depending on the compound. Organophosphates like acephate and chlorpyrifos have action levels in the low ppb range because of their toxicity. Pyrethroids like bifenthrin have higher thresholds, typically 0.5 ppm or above. A COA that shows multiple pesticides detected but passing suggests the grower used a broad-spectrum spray program and cut it close to harvest.
The pesticide panel itself varies by state. California tests for 66 compounds under its Category I and II lists. Michigan's panel includes 75. Colorado's is smaller, around 50. Some pesticides commonly used in agriculture, like abamectin and spinosad, are allowed in cannabis in certain states but banned in others. A batch that passes in Oregon might fail in California if it contains residues of a compound not on Oregon's panel but flagged in California.
Labs don't test for every possible pesticide. The panel is a regulatory snapshot, not a comprehensive screen. If a grower uses an off-label product not included in the state panel, it won't appear on the COA. This is rare but not unheard of, particularly with newer biopesticides or products marketed as organic that still leave residues.
Microbial Testing: Total Yeast and Mold, Coliforms, and the Limits of Culture-Based Methods
Microbial contamination is the leading cause of batch failures in most markets. COAs report total yeast and mold counts, bile-tolerant gram-negative bacteria, and specific pathogens like Salmonella, E. coli, and Aspergillus. The methods used, typically culture-based plating or qPCR, have different sensitivity and turnaround times.
Total yeast and mold counts are reported in colony-forming units per gram (CFU/g). Action levels vary widely: California sets the limit at 10,000 CFU/g, while Michigan allows 100,000 CFU/g for non-inhalable products. A sample at 9,500 CFU/g passes in California but signals poor drying or storage conditions. Yeast and mold grow when flower is dried too slowly, stored above 62% relative humidity, or exposed to condensation during cold storage.
Aspergillus testing is binary: detected or not detected. The four species tested, A. fumigatus, A. flavus, A. niger, and A. terreus, are opportunistic pathogens that pose serious risks to immunocompromised patients. A single detection fails the batch in most states. Aspergillus spores are ubiquitous in grow environments, particularly in soil-based systems and outdoor grows. The key is keeping flower dry enough that spores can't germinate.
Bile-tolerant gram-negative bacteria, including E. coli and Salmonella, indicate fecal contamination. This is rare in indoor grows but more common in outdoor or greenhouse operations where animals, runoff, or improperly composted amendments introduce pathogens. A detection here suggests a sanitation failure, not just a drying issue.
Some labs use qPCR for microbial testing instead of culture plating. qPCR is faster and more sensitive, but it detects DNA from dead and live cells. A sample that was contaminated, then irradiated or treated with ozone, might still show positive qPCR results even though no viable organisms remain. Culture-based methods only detect living microbes, so a qPCR positive and culture negative result suggests the contamination was killed post-harvest.
Heavy Metals: Lead, Cadmium, Arsenic, and Mercury in Cannabis
Heavy metal testing measures lead, cadmium, arsenic, and mercury, all of which accumulate in cannabis tissue when present in soil, water, or amendments. Action levels are set in parts per million, with lead and cadmium having the strictest limits due to their neurotoxicity and persistence in the body.
Lead contamination typically traces back to urban soils, old buildings, or water sources. Cannabis is a bioaccumulator, meaning it pulls heavy metals from soil more efficiently than many crops. A grow using native soil in an industrial area or near old infrastructure can fail lead testing even if the grower never applied a contaminated input. Cadmium shows up in phosphate fertilizers, particularly those derived from rock phosphate. Some cheap bloom boosters contain cadmium at levels that push flower over action limits after repeated applications.
Arsenic and mercury are less common but still appear in COAs, usually from contaminated water or specific amendments. Arsenic occurs naturally in some groundwater, particularly in the western U.S. Mercury contamination is rare but has been linked to certain fish-based fertilizers and improperly sourced kelp products.
Heavy metal failures are difficult to remediate. Unlike microbial contamination, which can sometimes be addressed with irradiation, heavy metals are elemental and can't be removed. A failed batch is usually a total loss, destined for destruction or, in some states, extraction into non-inhalable products where action levels are higher.
Terpene Profiles: What's Measured and What's Missing
Terpene testing is optional in many states but increasingly common as producers and consumers recognize the role terpenes play in effects and flavor. COAs typically report 10 to 40 terpenes, with the most abundant being myrcene, limonene, caryophyllene, pinene, linalool, and humulene.
Terpene content is reported as a percentage of total weight or in milligrams per gram. A flower with 2.5% total terpenes is considered high-terpene by commercial standards. Most flower falls between 1% and 2%. Terpene loss begins immediately after harvest and accelerates with heat, light, and time. A sample tested within 24 hours of harvest will show higher terpene levels than the same flower tested a week later, even if stored properly.
Labs use gas chromatography-mass spectrometry (GC-MS) or liquid chromatography for terpene analysis. GC-MS requires heating the sample, which can volatilize lighter terpenes and skew results. Liquid chromatography avoids this but is less common. The result is that some terpenes, particularly monoterpenes like pinene and ocimene, may be underreported on COAs using GC-MS.
Terpene profiles also vary by sample prep. Whole-flower samples retain terpenes better than ground samples, but grinding is necessary for homogenization. The time between grinding and analysis matters. A sample ground and tested immediately will show different terpene levels than one ground and left at room temperature for an hour.
Moisture Content and Water Activity: The Numbers That Predict Shelf Stability
Moisture content and water activity are often buried at the bottom of a COA, but they're critical for predicting how flower will behave in storage. Moisture content is the percentage of water by weight. Water activity (aw) measures the availability of that water to support microbial growth.
Ideal moisture content for cured flower is 10% to 12%. Below 8%, flower becomes brittle and terpenes volatilize. Above 14%, mold risk increases sharply. Water activity should be below 0.65 aw to prevent mold and below 0.60 aw for long-term storage. A COA showing 11% moisture but 0.68 aw suggests the water is not evenly distributed, possibly because the flower was dried too quickly or unevenly.
Some states require moisture and water activity testing; others don't. When it's optional, many producers skip it to save on testing costs. This is shortsighted. A batch that passes microbial testing at 0.63 aw but is stored in conditions that raise aw above 0.65 can develop mold post-COA, leading to customer complaints or dispensary returns.
What Labs Don't Test: Residual Solvents, Filth, and Foreign Matter
Residual solvent testing applies to concentrates and extracts, not flower, but it's worth understanding because some producers use solvents during post-harvest processing, such as ethanol washes for remediation. Solvents like butane, propane, ethanol, and hexane have strict action levels, typically in the low ppm range. A concentrate showing 50 ppm butane is well below the 5,000 ppm action level but suggests incomplete purging.
Filth and foreign matter testing is rare outside of California and a few other states. This involves visual inspection for insects, hair, mold, and other contaminants. It's subjective and inconsistent, but a failure here is a clear sign of poor sanitation or pest management.
Some contaminants, like glass particles from broken bulbs or metal fragments from trimming equipment, aren't tested for at all. These show up as customer complaints, not COA failures. The same goes for off-flavors from pesticides, nutrients, or environmental contaminants. A COA can show a batch as clean while the flower tastes like sulfur or has a chemical aftertaste.
How Producers Game the System
The most common manipulation is sample selection. Producers send their best colas for testing, knowing the COA will represent the entire batch. This is legal but misleading. A batch tested at 24% THC might average 20% across all flower, with the tested sample pulled from the top of the canopy under ideal light.
Another tactic is lab shopping. Producers send splits of the same sample to multiple labs and use the COA with the highest numbers. Labs vary in calibration, methodology, and reporting practices, so the same flower can test at 22% THC at one lab and 24% at another. Some labs are known in the industry for running hot, consistently reporting higher cannabinoid levels than competitors. Producers gravitate toward these labs for marketing purposes, even if the numbers don't reflect reality.
Retesting is another gray area. If a batch fails microbial or pesticide testing, some states allow retesting after remediation. Producers use ozone, irradiation, or other treatments to kill microbes, then retest. The COA shows a pass, but the flower has been processed in ways that may affect quality. Irradiation, for example, can degrade terpenes and alter flavor.
Some labs offer faster turnaround times for higher fees, creating an incentive to pay for results. While outright fraud is rare and carries serious penalties, the competitive pressure on labs to retain clients can lead to lenient interpretations of borderline results.
What Buyers Look for Beyond the Top-Line Numbers
Sophisticated buyers, particularly those purchasing for extraction or medical markets, look past total THC. They check for pesticide detections, even if below action levels. They compare moisture and water activity to assess storage risk. They look at CBN levels to gauge freshness and terpene profiles to predict flavor and effects.
A COA showing multiple pesticides detected but passing suggests the grower is pushing limits. A high CBN relative to THC indicates old or degraded flower. Low terpene levels, particularly of myrcene and limonene, suggest the flower was dried too hot or stored too long.
Buyers also cross-reference COAs with batch size. A 50-pound batch tested with a single sample is less reliable than a 500-pound batch tested with composite sampling from multiple points. Some states require composite sampling for large batches; others don't. When it's optional, many producers skip it to save money, increasing the risk that the COA doesn't represent the full batch.
Reading Between the Lines: What a Clean COA Doesn't Tell You
A COA can show a batch as compliant while the flower is mediocre. Potency doesn't correlate directly with quality. A 28% THC flower grown poorly, dried too fast, and stored badly will underperform a 20% THC flower grown well. The COA doesn't measure bag appeal, cure quality, or how the flower smokes.
Terpene content is a better proxy for quality than cannabinoid levels, but even that's incomplete. A flower with 2% total terpenes dominated by caryophyllene will have a different profile than one with 2% terpenes split evenly between myrcene, limonene, and pinene. The COA gives you the percentages, not the experience.
Microbial testing is a snapshot. A batch that passes at 8,000 CFU/g total yeast and mold can cross 10,000 CFU/g a week later if stored improperly. The COA is valid at the time of testing, not indefinitely. This is why some buyers retest flower before accepting large purchases, particularly if the COA is more than 30 days old.
How to Use COAs in Pricing and Negotiation
COAs are use in pricing negotiations. A batch with 24% total THC, no detected pesticides, and a full terpene profile commands a premium. A batch at 18% THC with two pesticides detected but passing and low terpenes sells at a discount. The difference can be $400 to $600 per pound in competitive markets.
Producers should compare their COAs to market averages for their strain and region. If you're growing a strain known for 20% to 22% THC and your batch tests at 19%, you're below market. If it tests at 25%, you're above, and you should price accordingly. Terpene levels follow the same logic. A myrcene-dominant strain testing at 1.2% myrcene is strong; at 0.4%, it's weak.
Buyers use COAs to justify lower offers. They'll point to detected pesticides, elevated CBN, or low terpenes as reasons to reduce price. Producers should be ready to explain these numbers. If CBN is high because the strain naturally converts THCA to CBN late in flower, that's different from CBN from poor storage. If a pesticide is detected because it's a biopesticide allowed under organic standards, that's different from a synthetic detection.
State-by-State Variability and What It Means for Multi-State Operators
Testing requirements vary enough between states that a batch passing in one market might fail in another. California's pesticide panel is broader than most states, so flower that passes in Nevada might fail in California. Michigan's microbial limits are more lenient than California's, so a batch at 95,000 CFU/g total yeast and mold passes in Michigan but fails in California.
Multi-state operators face the challenge of meeting the strictest standard if they want flexibility in where they sell. This usually means adhering to California's testing requirements regardless of where the flower is grown. It's expensive, but it avoids the scenario where a batch tests clean in one state, then fails when moved to another.
Some states require testing at licensed in-state labs, prohibiting the use of out-of-state COAs. This creates redundancy and cost for producers operating across borders. A batch grown in Oregon and sold in California must be tested twice, once in each state, even if the methodologies are identical.
The Future of COA Transparency and What's Changing
Pressure is building for standardized testing protocols and more transparent reporting. Some states are moving toward requiring labs to report all detected compounds, not just those above action levels. This would eliminate the gray zone where pesticides are present but not flagged as failures.
Blockchain-based COA verification is being piloted in a few markets, allowing buyers to confirm that a COA matches the batch and hasn't been altered. This addresses the problem of fake or doctored COAs, which are rare but not unheard of in less regulated markets.
More buyers are demanding full-panel testing, including terpenes, moisture, and water activity, even when it's optional. This is driven by consumer education and competition. As the market matures, the producers who invest in comprehensive testing and transparent reporting gain an edge over those who do the minimum.
Frequently asked questions
What's the difference between total THC and delta-9 THC on a COA?
Delta-9 THC is the active form present in raw flower, typically under 1%. Total THC includes delta-9 plus the converted value of THCA using the formula: total THC = delta-9 + (THCA × 0.877). Total THC represents potential potency after decarboxylation, which occurs during smoking, vaping, or cooking.
Can a batch pass pesticide testing but still be rejected by buyers?
Yes. Labs report pesticides detected below action levels as passing, but many buyers, especially in medical or concentrate markets, reject any detectable pesticide residue. A COA showing myclobutanil at 0.08 ppm passes California's 0.1 ppm limit but signals risk to buyers who want zero detections.
Why do the same flower samples test differently at different labs?
Labs vary in calibration, sample prep, and methodology. Moisture content at testing, grinding technique, and instrument sensitivity all affect results. Some labs consistently report higher cannabinoid levels due to looser quality controls or calibration drift, a practice known as running hot.
What does high CBN relative to THC indicate on a COA?
Elevated CBN suggests cannabinoid degradation from age, heat, or light exposure. THCA converts to CBN over time, so a batch with 1% CBN and 18% THC likely sat too long before testing or was stored poorly. Fresh flower typically shows CBN below 0.3%.
How do moisture content and water activity differ?
Moisture content is the percentage of water by weight, ideally 10% to 12% for cured flower. Water activity measures how available that water is for microbial growth. A batch can have acceptable moisture but high water activity if dried unevenly, increasing mold risk even if it passes initial testing.
What's the risk of using a COA older than 30 days?
COAs are valid at the time of testing but don't account for post-test degradation. Terpenes volatilize, cannabinoids oxidize to CBN, and microbial counts can rise if storage conditions aren't ideal. Buyers often retest flower with COAs older than 30 days before accepting large purchases.
Can failed batches be retested after remediation?
Most states allow retesting after remediation for microbial failures using ozone or irradiation. The COA will show a pass, but remediation can degrade terpenes and alter flavor. Heavy metal failures cannot be remediated, and pesticide failures are typically permanent unless the detection was a lab error.
Why don't all COAs include terpene testing?
Terpene testing is optional in many states and adds $50 to $150 per sample. Some producers skip it to reduce costs, but buyers increasingly demand terpene profiles to assess quality and predict effects. Markets with educated consumers and competitive pricing make terpene data a necessity, not a luxury.
Sources
The cannabis newsletter you forward to your team.
Federal policy, market data, grower alerts, and the one story that matters today. Sent every weekday at 7am. Free.
No spam. Unsubscribe with one click. 21+ only.
Related from Grow

Coco Coir Feeding Schedule: EC Targets and CalMag Timing
Commercial feeding protocols for coco from seedling through flush, with EC benchmarks, cation exchange considerations, and CalMag supplementation rates.

Hydro vs Soil Cannabis 2026: The Cost and Yield Math
Commercial growers face hard trade-offs between hydroponics and soil. We break down the real numbers on setup cost, yield per square foot, labor, and failure modes.

CO2 Supplementation: When the Math Works and When It Doesn't
Running 1200-1500 ppm CO2 can add 20-30% yield, but only if your room is sealed, your light is dialed, and you can stomach the power bill.
More from the newsroom

South Carolina GOP Attorney General Candidates Clash on Medical Marijuana
Republican primary debate exposed sharp divisions over cannabis policy enforcement and hemp regulation ahead of June 10 primary.

Texas Appeals Court Extends Injunction Blocking THC Ban Through June 6
The Fifth Court of Appeals reinstated a temporary restraining order, giving hemp retailers another week before enforcement begins.

Pennsylvania Hemp Guild Responds as Adult-Use Cannabis Bill Advances
State trade group calls for hemp protections as Senate committee advances recreational marijuana legislation.