Massachusetts CCC Files Annual Report, Marks $10B Decade
The Cannabis Control Commission's latest annual report marks $10 billion in sales over 10 years, giving investors and operators a new benchmark for the state's maturing market.

Detailed image of cannabis buds spilling from a glass jar, highlighting the green texture.
CCC Marks $10 Billion Over a Decade
The Massachusetts Cannabis Control Commission (CCC) released its annual report and used it to mark $10 billion in sales across 10 years, according to Talking Joints Memo.
That's the headline number. It's a big one.
Massachusetts voters approved adult-use legalization through a ballot question in November 2016, and the CCC was created in 2017. The first adult-use stores opened in November 2018. The decade framing most likely runs from the 2016 vote, though the source we reviewed doesn't say so.
What We Could and Couldn't Verify
The signal confirms the report and the $10 billion milestone, but not the underlying breakdown.
We didn't have the report's text in hand, so we can't say how much of the $10 billion is adult-use versus medical, whether it's gross retail sales or something narrower, or what the most recent fiscal year looked like. Those distinctions matter.
A cumulative figure also hides the shape of the curve. Ten billion dollars could reflect steady growth or a plateau with a long tail of early gains. Per-year sales, not the running total, tell you which.
The Tax Math Behind the Milestone
Massachusetts stacks a 10.75% excise tax and a 6.25% sales tax on adult-use sales, with host communities allowed to add up to 3%.
Here's an illustration, not a reported figure. At the 17% combined state rate, $10 billion in fully taxable sales would imply roughly $1.7 billion in state-level receipts. That's an upper bound. Medical sales aren't taxed the same way, and the report's composition isn't confirmed.
Still, the scale is real. The state gets a meaningful cut of every dollar a licensee books, and a stable tax base is the strongest argument regulators have for their own budgets.
What Operators Should Pull From the Report
The decade total matters less than five line items operators can benchmark against their own books.
- Year-over-year sales growth, in percentage terms, for the latest fiscal year
- Average retail price per gram or per ounce, and the direction it moved
- Active license counts by category, including cultivators and retailers
- Share of sales and licenses tied to social equity and economic empowerment applicants
- Enforcement actions and compliance trends
Price is the one to watch first. A market can post record dollar sales while per-unit prices fall, and that's a squeeze, not a boom. Cultivators feel it before retailers do.
The Margin Question Behind the Revenue
Revenue milestones don't equal profit, and licensed operators in a mature state market compete on cost, not access.
Massachusetts has a dense retail footprint and a concentrated set of multistate operators (MSOs) alongside local owners. Where supply outruns demand, wholesale pricing erodes and gross margins thin. For operators carrying 280E exposure, taxes are computed on gross profit, not net income, so every basis point of lost gross margin hits harder.
That's the real read on a $10 billion headline. The pot is large, but the slices keep getting thinner.
What to Watch Next
The signal to track is whether the next quarterly sales data confirms growth or flat demand.
For full background on this story, see the CannIntel topic hub on the Massachusetts cannabis market. It tracks licensing, pricing and regulatory moves as they develop.
Neighboring states are the comparison set. Operators eyeing expansion should weigh Massachusetts against New York and California, where licensing structures and tax regimes differ. Investors should compare Massachusetts' per-store sales to those markets before assigning a multiple.
The next test is the CCC's monthly sales data and the licensee financials that follow. If the report's per-year numbers show growth, the $10 billion headline is a floor. If they show a plateau, it's a ceiling.
Sources
The cannabis newsletter you forward to your team.
Federal policy, market data, grower alerts, and the one story that matters today. Sent every weekday at 7am. Free.
No spam. Unsubscribe with one click. 21+ only.
Related from Business

Vireo Growth acquires Palatka cannabis facility for $21M
The multistate operator paid $21 million for a Palatka site, a hard-asset bet on Florida's medical market while Canada and Germany show the cost of overbuilding.

Vireo Makes Latest $21M Florida Purchase, Deepening MSO Foothold
MJBizDaily reported the multistate operator's newest Florida deal, a $21 million purchase that extends a pattern of incremental buying in a license-capped medical market.
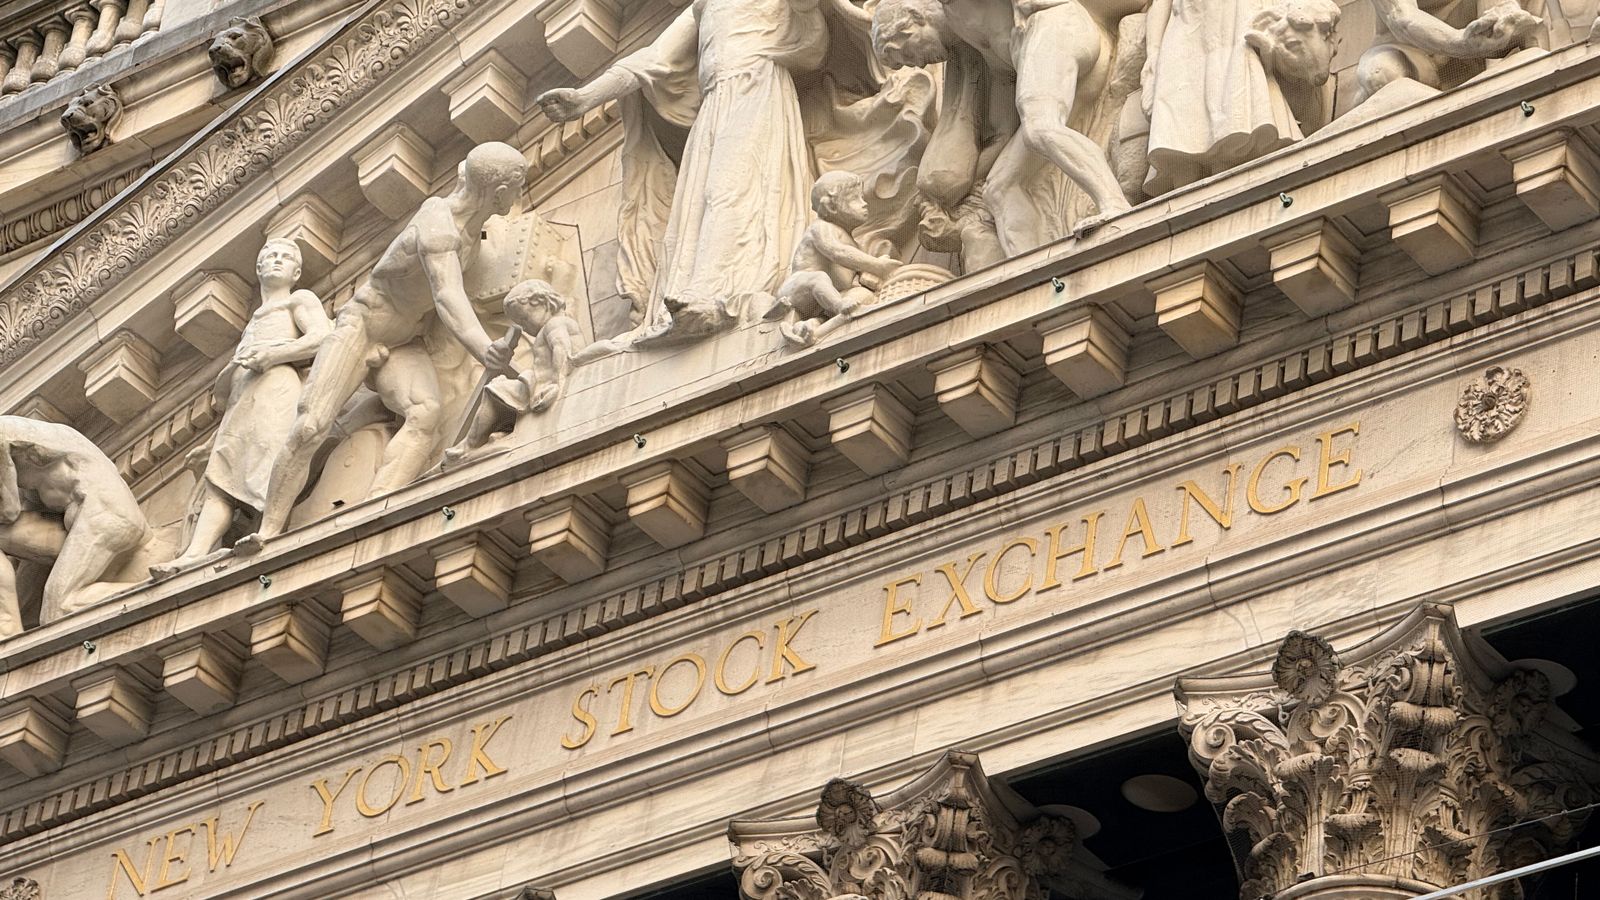
Nasdaq Offers Safe Harbor Financial 180-Day Compliance Extension
SHF Holdings, the Denver fintech behind Safe Harbor Financial, received written Nasdaq notice of a 180-day extension to a compliance deadline.
More from the newsroom

DOJ indicts Virginia lawmaker, six others over hemp THC shop
Federal prosecutors charged a Virginia state lawmaker and six others over a hemp THC operation, testing where hemp ends and marijuana begins.

Virginia Senator Faces Federal Marijuana and Fraud Charges
Marijuana Moment reported Oct. 22 that a top Virginia senator faces federal marijuana and fraud charges; the counts, court and named defendant await confirmation.

New Jersey Bill Extending Hemp Drink Sales Advances
A bill to extend New Jersey hemp drink sales moved forward Oct. 22, but the public record behind the headline is thin.